
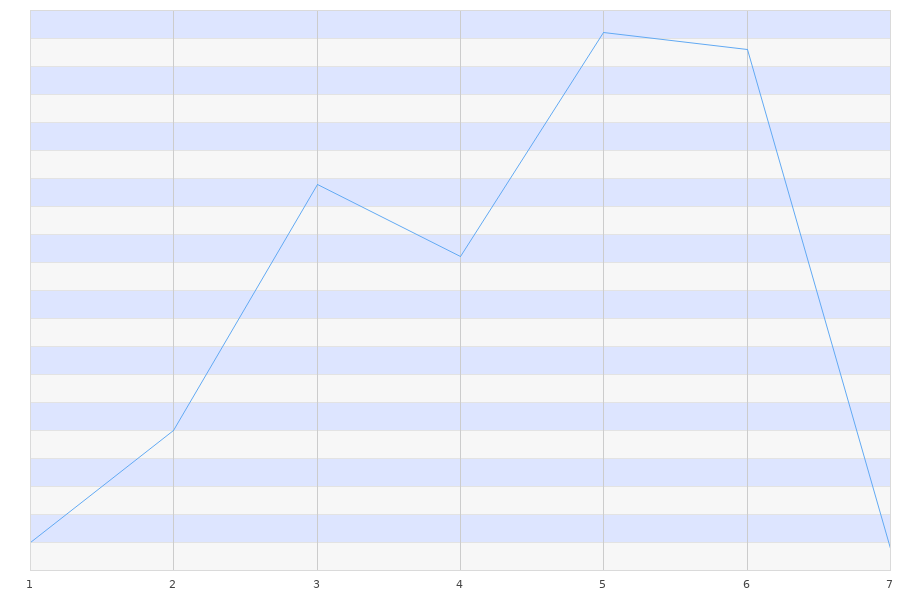
Wykres zmian wartości w okresie czasu
Index: N10 | Polska | okres 2026-01-01 - 2026-08-01
| Pozycja | Indeks | Data | Średnia | Zmiana |
|---|---|---|---|---|
| 0 | N10 | 2026-01 | 915.00 | 0 |
| 1 | N10 | 2026-02 | 935.00 | 20 |
| 2 | N10 | 2026-03 | 979.00 | 44 |
| 3 | N10 | 2026-04 | 966.00 | -13 |
| 4 | N10 | 2026-05 | 1006.00 | 40 |
| 5 | N10 | 2026-06 | 1003.00 | -3 |
| 6 | N10 | 2026-07 | 914.00 | -89 |


